Difference between revisions of "Result Processing and Totaling"
From JUNO Wiki
Jump to: navigation, search
(Created page with "== '''Result Processing and Totaling''' == After completion of entire process of marks upload and freezing the final step is Result processing and totaling. == ''' Roles ''' =...") |
|||
| (2 intermediate revisions by the same user not shown) | |||
| Line 1: | Line 1: | ||
== '''Result Processing and Totaling''' == | == '''Result Processing and Totaling''' == | ||
After completion of entire process of marks upload and freezing the final step is Result processing and totaling. | After completion of entire process of marks upload and freezing the final step is Result processing and totaling. | ||
| + | |||
== ''' Roles ''' == | == ''' Roles ''' == | ||
Exam Admin | Exam Admin | ||
| Line 39: | Line 40: | ||
* Result Calculation | * Result Calculation | ||
| + | [[File:Result p1.png|border|center|frameless|1357x1357px]] | ||
* Exam Student Grade | * Exam Student Grade | ||
| + | |||
| + | [[File:Result p2.png|border|center|frameless|900x900px]] | ||
* Grade wise Student Count | * Grade wise Student Count | ||
| + | |||
| + | [[File:Resultp3.png|border|center|frameless|900x900px]] | ||
Latest revision as of 13:28, 27 March 2020
Contents
Result Processing and Totaling
After completion of entire process of marks upload and freezing the final step is Result processing and totaling.
Roles
Exam Admin
Path
Exam Admin >> Result Compilation >> Result Process
Input Needed
- Department Name
- Exam Name
- Syllabus Pattern
- Class/Semester
- Spot Evaluator
- Course Name
Functionality
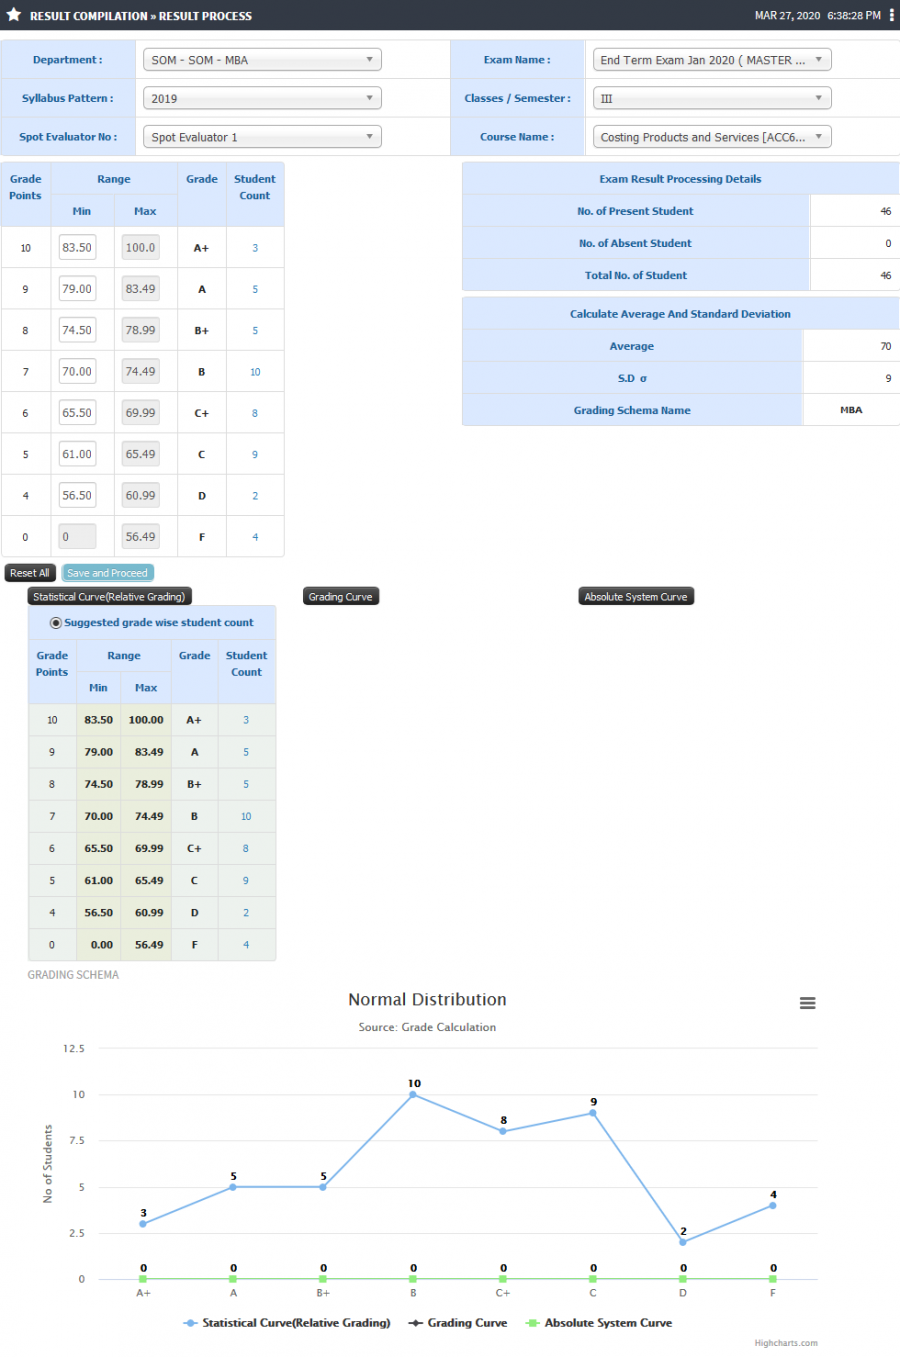
1) Result Calculation
- Based on grading policy defined(Absolute or Relative) system shall auto calculate Average and S.D.
- Depending on the Average and S.D calculated the range and grades for students shall be displayed.
- User may opt to edit the range in order to alter the final result, depending on the range the grades applicable to student shall change automatically.
- Option would be available for Relative, Absolute and Grading curve. Based on selection of grading curve the normalization distribution graph is calculated and displayed.
- User can see final submitted internal and external marks for students.
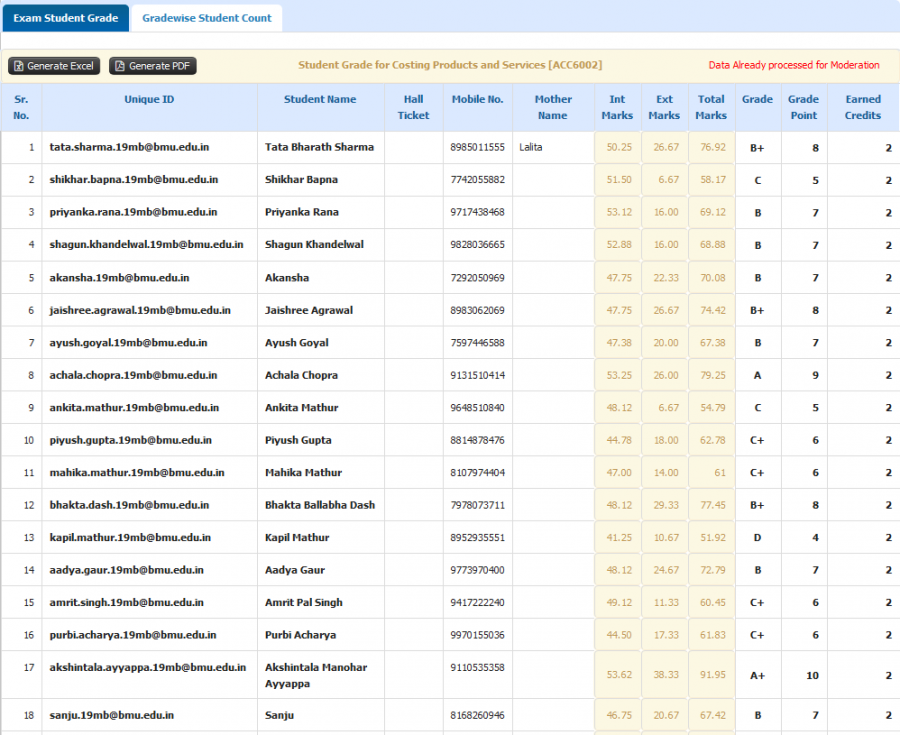
2) Exam Student Grade
- Final result with student details, marks achieved shall be visible.
- After an user clicks on Apply grade, the grade and grade point calculations will be performed.
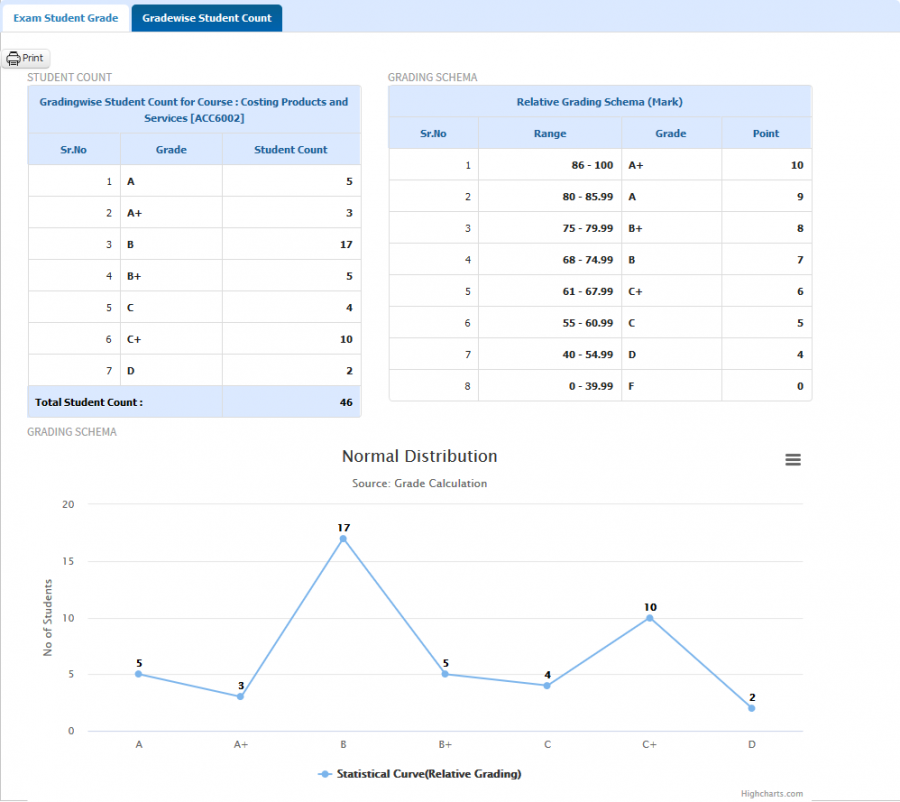
3) Grade wise Student Count
- Grade wise students count would be fetched in an report format displaying how many student have achieved grade A, B, etc.
- Grading schema with range and Normal distribution for final results shall be visible.
Step by step
Follow Below mentioned steps
- Result Calculation
- Exam Student Grade
- Grade wise Student Count
{"minExpandLevel":2}
- Initial Configuration
- Terminology Used in Initial Configuration
- Basic Structure Creation
- Mappings
- Liaisons
- Master Lists
- Legacy Data Upload
- Initial Data Template
- Employee Data Template
- Student Data Template
- Course Data Template
- Infrastructure Data Template
- Finance Data Template
- Stock/Inventory Data Template
- Library Data Template
- Attendance Data Template
- Grade/Marks Data Template
- Quiz Questions Data Template
- Employee Profile Data Template
- Initial Configuration FAQ
{"minExpandLevel":2}
{"minExpandLevel":2}
{"minExpandLevel":2}
- Admission
- Terminology Used in Admission
- Admission Configuration
- Guideline Configuration
- Departments and Program association
- Entrance exam Configuration
- Admission Quota and Category Configuration
- Admission Document Configuration
- Admission intake configuration
- Admission Eligibility Configuration
- Admission Rounds Configuration
- Merit List Configuration
- Direct Admission
- Admission Process
- Admission Test
- Lead Management
- Admission FAQ
{"minExpandLevel":2}
{"minExpandLevel":2}
- Academics
- Terminology Used
- Program Creation
- Syllabus Pattern Creation
- Syllabus Structure
- Course Outline
- Faculty Course Management
- Student Course Management
- Time Table
- Course File
- Attendance
- Concurrent Assessment
- Outcome Based Evaluation
- Learning Management System(LMS)
- Topic Registration
- Synopsis
- Defining Research Project
- Creating Evaluation Parameter
- Project Guide Configuration
- Synopsis Configuration
- Submission of Synopsis by Student
- Synopsis Approval by Guide
- Synopsis Approval by HOD
- Synopsis Approval by Thesis Department
- Synopsis Approval by Dean Login
- Email Alerts to referee
- Synopsis Approval by Referee Login
- Colloquium
- Thesis
- Defining Research Project
- Creating Evaluation Parameter
- Project Guide Configuration
- Thesis Configuration
- Submission of Thesis by Student
- Thesis Approval by Guide
- Thesis Approval by HOD
- Thesis Approval by Thesis Department
- Thesis Approval by Dean Login
- Thesis Approval by Referee Login
- Referee Report
- Request for Open Defense
- Open Defense Request Approval by HOD
- Open Defense Request Approval by Chair Person
- View Referee & Guide Report
- Final Thesis
- SIP
- On-Line Test Through Course File
- Feedback
- Student Leave
- Mentor Student Module
- Academics FAQ
{"minExpandLevel":2}
- Exam
- Terminology Used in Exam
- Exam Admin Role
- Creating University
- Defining Stream
- Defining Qualification
- Open Electives
- Syllabus and Pattern Creation
- Syllabus and Subject
- Term Exam Structure
- Exam Duty Configuration
- SMS and e-Mail Pattern Configuration
- Result Reference Key Configuration
- Exam Center Code Configuration
- Exam Schedule Configuration
- Exam Configuration
- Paper Valuer
- Answer Sheet Correction Allocation
- Exam Form Notification
- Student Exam Form
- Hall Ticket Generation
- Exam Paper Finalization
- Exam Invigilator
- Exam Hall Attendance
- Grace Policies
- Internal - External Marks Entry
- Spot Evaluation Marks Entry
- Internal Exam Marks
- Vocational Subject Marks
- Forward Marks for Result Processing
- Grace Calculation
- Process Result
- Marks Moderation
- Result Processing and Totaling
- Student Exam Dashboard
- Legacy Marks Entry
- Internal Exam Configuration
- Internal Subject Allocation
- Internal Subject Marks
- Faculty Role
- Student Role
- Exam FAQ
{"minExpandLevel":2}
- Finance
- Terminology Used in Finance
- Budget
- Defining Budget Title
- Defining Groups and Subgroups and Ledgers
- Associating Employees with Ledgers for Budgetary Estimates
- Budget Estimates by Employees
- Scrutiny and Revision of Budget by Finance Admin
- Finalizing and Freezing Budget Amounts
- Notification to Employees on Budgeted amounts
- Budgetary Alerts
- Budget Variance
- Fees
- Terminology Used in Fees
- Academic Fees Structure
- Fee Components
- Fee Amount corresponding to Quota and Category
- Sponsorship Bodies
- Fees Installments
- Part Payments
- Fee Advances
- Fee Refund
- Late Fees
- Admission Cancellation
- Invoices and Receipt
- Scholarship
- Sponsorship
- Hostel Fees
- Transport Fees
- Exam Fees
- Library Fees
- Miscellaneous Fees
- Fines
- Fees FAQ
- Salary
- Salary Configuration
- Employee Salary Parameter Mapping
- Employee Salary Adjustments
- TDS Configuration
- TDS Calculation
- Salary Calculations
- Leave Availing Rules
- Arrears Configuration
- Arrears Calculation
- Employee Account Details
- Employee Salary Payable
- Employee Salary Transfer
- Visiting Faculty Payable
- PF
- ESIC
- Insurance
- Gratuity
- Leave Encashment
- LTA
- Medical Reimbursement
- Monthly Reports
- Yearly Reports
- CTC
- FnF
- Purchase/Vendor Accounting
- Sales/Client Accounting
- General Accounts
- Investment Management
- Endowment Management
- Employee Society
- Finance FAQ
{"minExpandLevel":2}
- HR
- Terminology Used in HR
- Recruitment
- Terminology used in recruitment
- Recruitment Liaison
- University Post Configuration
- Recruitment Process
- Recruitment Liaison Disclaimer
- Recruitment Liasoning Finance Association
- Office Document Configuration
- Recruitment Test Configuration
- Applicant Employee registration
- Log Report
- Registered Applicant Employee
- Applicant Employee Profile Report
- Applicant Employee Referenced Detail
- Applicant Employee Documents
- Call for GD/PI
- GD or PI Marks
- Call For Interview
- Offer Letter
- Joining Report
- Service Book
- Service Book
- Muster
- Muster Policy Creation
- Employee Worktime
- Working Hours
- Biometric Devices
- Fingerprints
- Daily Attendance Report
- Monthly Muster Report
- Muster Freezing
- Input for Salary Calculation
- Leave Deductions
- Late coming and Early going
- Consolidated Attendance Report
- Muster Incomplete Task
- Missed Punch Request
- Request for waive off short day
- Leave
- Salary
- Salary Configuration
- Employee Salary Parameter Mapping
- Employee Salary Adjustments
- TDS Configuration
- TDS Calculation
- Salary Calculations
- Leave Availing Rules
- Arrears Configuration
- Arrears Calculation
- Employee Account Details
- Employee Salary Payable
- Employee Salary Transfer
- Visiting Faculty Payable
- PF
- ESIC
- Insurance
- Gratuity
- Leave Encashment
- LTA
- Medical Reimbursement
- Monthly Reports
- Yearly Reports
- CTC
- FnF
- Employee Profile
- Personal Details
- Family Details
- Medical Details
- Qualification
- Subject Taught
- Training
- Conference/Seminar/Conclave
- Workshop
- Publications
- Consultancy
- Research Project
- Research Guidance
- Membership
- Patents/Copyrights
- Skill Upgradations
- Research Interest
- Significant Achievement
- Other Contributions
- Appointment Status
- Service Book
- Self Contribution/Addl.Responsibilities
- Foreign Collaboration
- Brief Profile
- Appraisal
- Grievance
- Contractual Appointment
- Resignation
- No Dues
- Full and Final Settlement
- HR FAQ
{"minExpandLevel":2}
- Procurement and Stores
- Terminology Used in Procurement and Stores
- Infrastructure
- Maintenance
- Stock
- Product Search/Edit
- Dead Stock Configuration
- Dead Stock Register
- Stock Allocation
- Infrastructure Incharge Allocation
- Employee Seating Arrangement
- Vendors
- Vendor Feedback
- Marketing Company
- Gate Pass
- Good Receipt Note (GRN)
- Generate Work Order
- Internal Maintenance Report
- External Maintenance Report
- Stock Reports
- Employee Login(Stock)
- Stock FAQ
- Inventory
- Purchase
- Abbreviations
- Add Vendor
- Vendor Registration Configuration
- Vendor Approval
- Vendor Feedback
- Add Base Product
- Product Search/Edit
- Purchase Requisition Authority
- Purchase Authority
- Signature Authority
- Purchase Requisitions
- Generate Requisition
- Generate Purchase Order Without RFQ
- Request for Quotations
- Add Quotation
- Quotation Opening
- Quotation Analysis
- Quotation Configuration
- Approved Rate Contracts
- Tender Configuration
- Tender
- List of Purchase Orders
- Purchase Order Clauses
- Add Delivery Challan
- Add Invoice
- Purchase Payment Request
- Reports
- Vendor Login
- Employee Login
- Student Login
- Finance Login
- Purchase FAQ
{"minExpandLevel":2}
- Research
- Terminology Used in Research
- Employee Research Contribution
- Funded Research Project
- Research Courses
- Admission
- Assessment
- Synopsis
- Defining Research Project
- Creating Evaluation Parameter
- Project Guide Configuration
- Synopsis Configuration
- Submission of Synopsis by Student
- Synopsis Approval by Guide
- Synopsis Approval by HOD
- Synopsis Approval by Thesis Department
- Synopsis Approval by Dean Login
- Email Alerts to referee
- Synopsis Approval by Referee Login
- Thesis
- Defining Research Project
- Creating Evaluation Parameter
- Project Guide Configuration
- Thesis Configuration
- Submission of Thesis by Student
- Thesis Approval by Guide
- Thesis Approval by HOD
- Thesis Approval by Thesis Department
- Thesis Approval by Dean Login
- Thesis Approval by Referee Login
- Referee Report
- Request for Open Defense
- Open Defense Request Approval by HOD
- Open Defense Request Approval by Chair Person
- View Referee & Guide Report
- Research FAQ
{"minExpandLevel":2}
{"minExpandLevel":2}
{"minExpandLevel":2}
- Internal Communication
{"minExpandLevel":2}
- Committees
- Terminology Used in Committees
- Add Committee Details
- Update Details
- Committee Member
- Committee Responsibility
- Committee Meeting
- Agenda Creation
- Approve Agenda
- Send for Notification
- MOM Tracking
- MOM Approval
- MOM Sharing
- Announcement
- Event
- Meeting Attendance
- Committee Institute Mapping
- Committee Document Verification
- Budget
- HR request Generation
- Alert to Principal/HR/Director
- HR Approval
- Committee Approval
- Committee Agenda
- Committees FAQ
- Terminology Used in Committees
{"minExpandLevel":2}
{"minExpandLevel":2}
{"minExpandLevel":2}
- Hostel
- Terminology Used in Hostel
- Hostel Configuration
- Hostel Admission
- Hostel Allocation
- Registration Approval
- Generation of Merit List
- Student Parent Contact Details
- Generation of I-Card
- Mess Allocation
- Stock Allotment
- Room Transfer/ Cancellation
- Occupant Search
- Occupant Attendance
- Leave/Night-out Request
- Fine Imposition
- Group Fine
- Guest House
- Guest Room Request Approval Configuration
- Guest Room Booking
- Guest Room Approval
- Hostel Complaint and Maintenance
- Hostel and Related Reports
- Hostel FAQ
{"minExpandLevel":2}


